> ## Documentation Index
> Fetch the complete documentation index at: https://attlas.so/docs/llms.txt
> Use this file to discover all available pages before exploring further.
# AI Reports
> Generate in-depth, AI-powered analysis reports to evaluate chat performance, audience behavior, and content gaps.
AI Reports analyze your chat's historical interactions, visitor behavior, and knowledge coverage to deliver actionable insights and recommendations.
AI Reports is a **Pro feature**. Upgrade your workspace plan to generate and export custom AI reports.
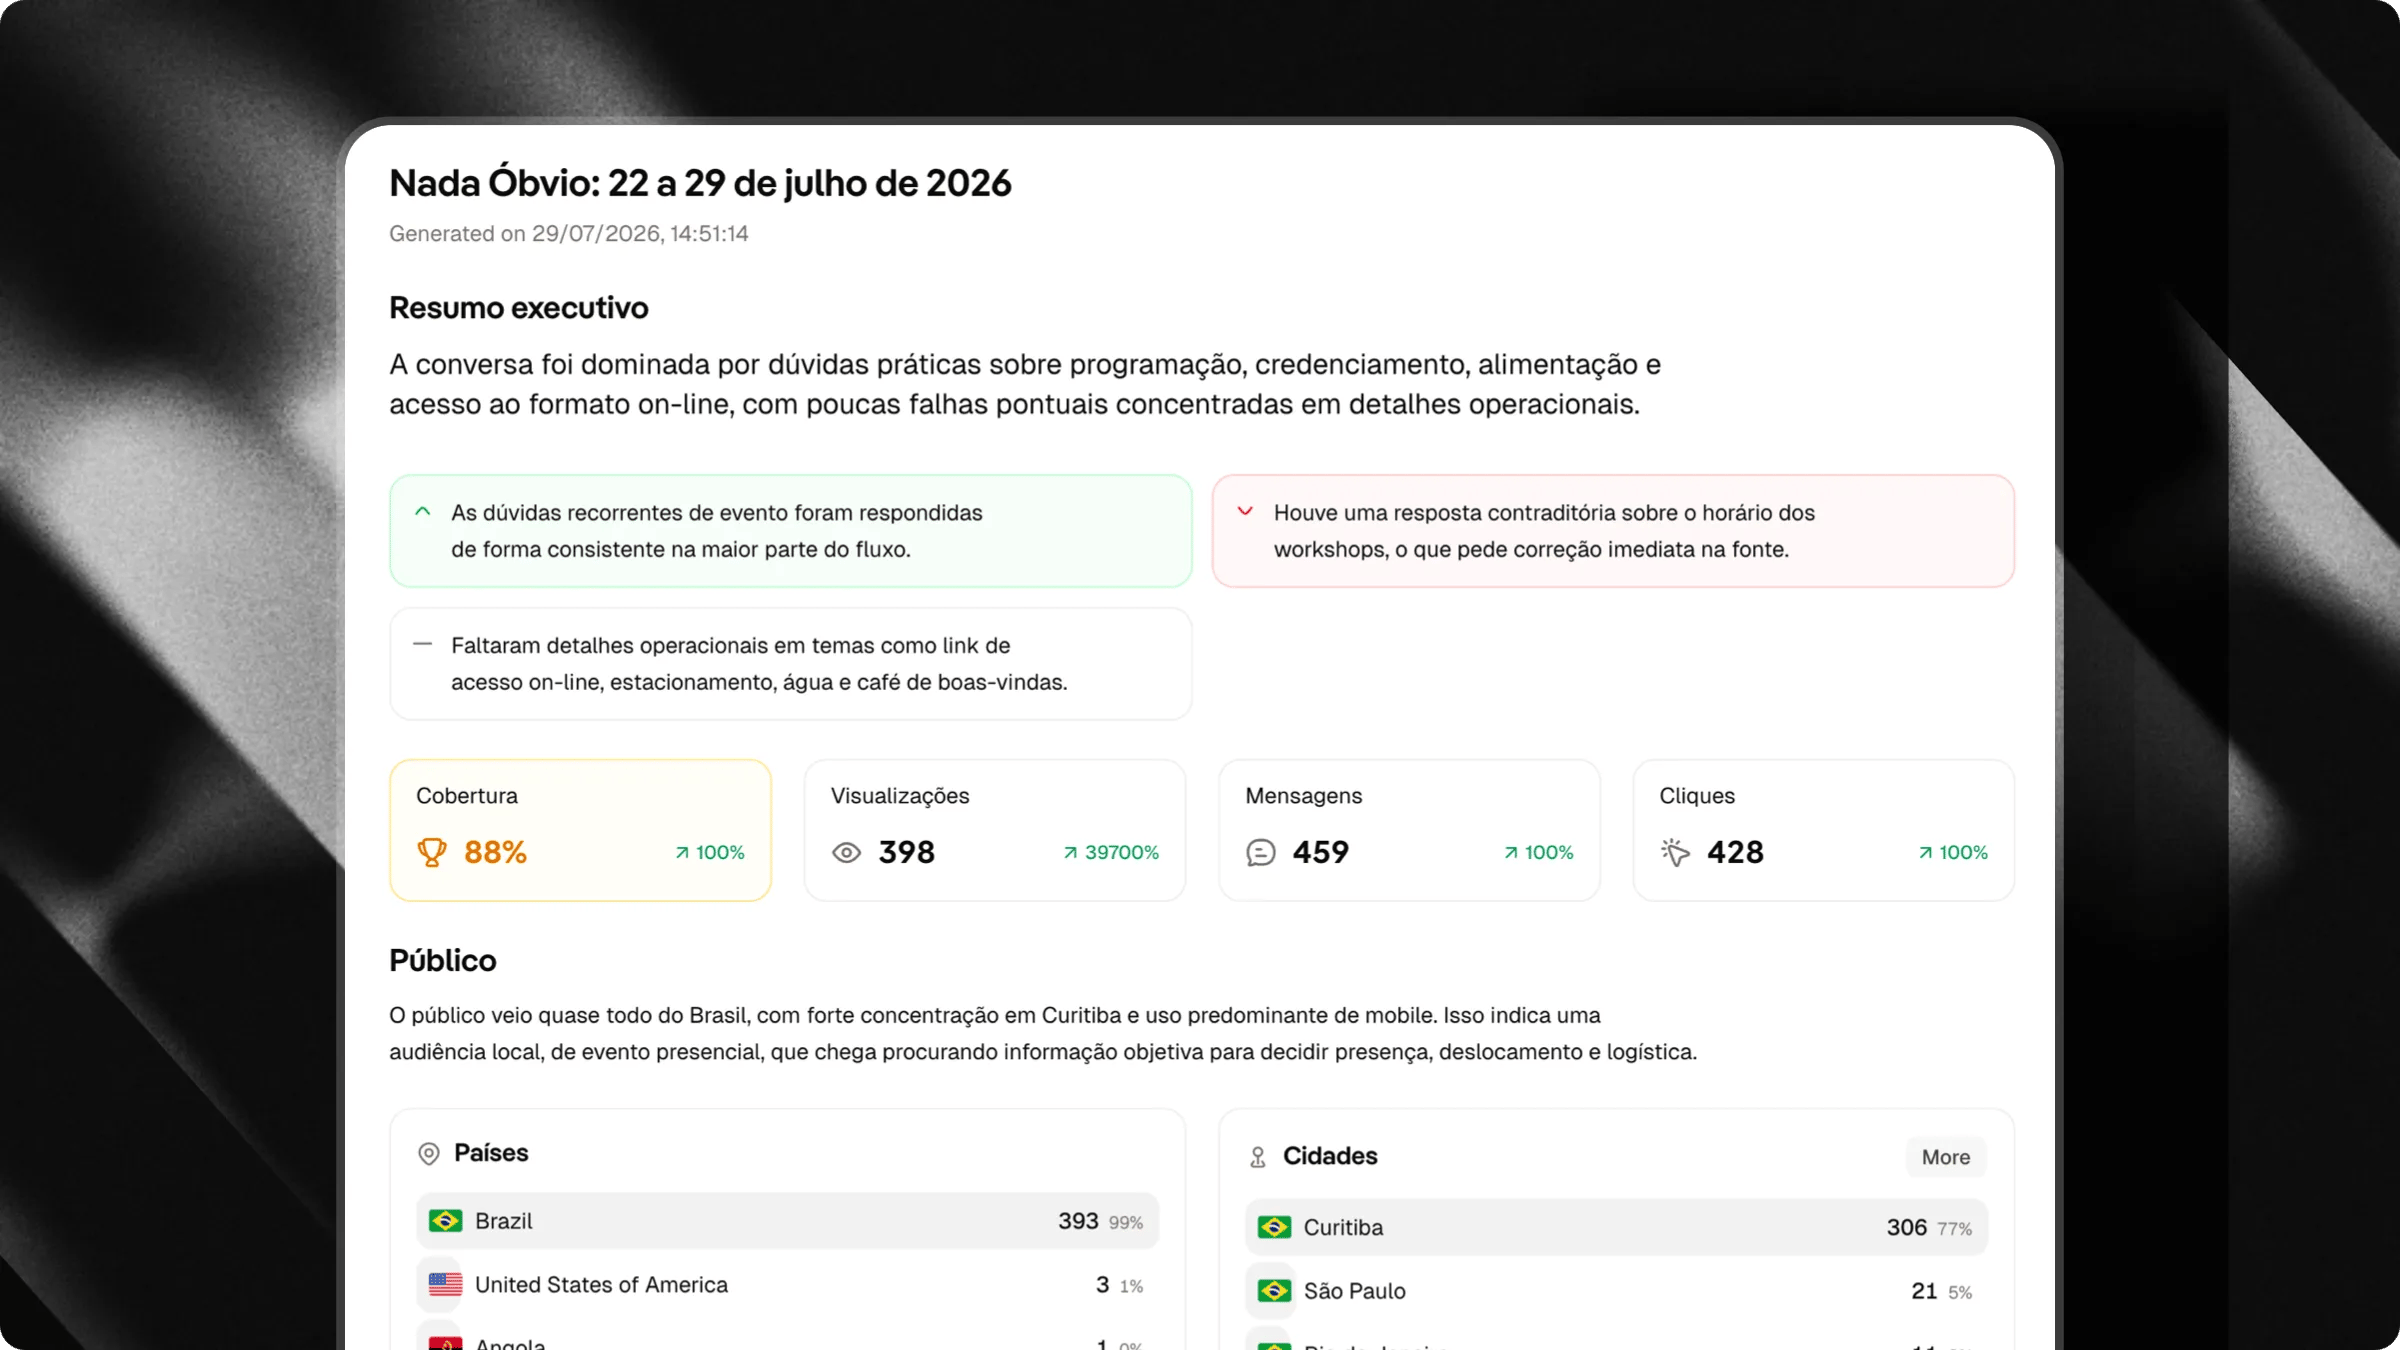 To access AI Reports, click the **Reports** button in the top-right corner of the **Overview** dashboard, or navigate directly to `/overview/your-chat-slug/reports`.
***
## Generating a Report
1. Click **Reports** in the top navigation of the Overview dashboard.
2. Click the **Generate Report** button.
3. Select your desired time period:
* **Pre-set ranges:** Last 7 days, 14 days, 30 days, 90 days, or 12 months.
* **Custom range:** Select precise start and end dates using the calendar picker.
4. Choose your preferred **Report Language** (for example English, French, Portuguese, Spanish, German, or Japanese). The report will be generated entirely in the selected language.
5. Click **Generate**. Attlas will analyze your chat history and generate your report in seconds.
Available historical date ranges depend on your workspace plan level.
***
## What's Included in a Report
Each AI Report compiles data and AI analysis into actionable sections:
* **Executive Summary:** Key highlights, top performing areas, and primary takeaways.
* **Audience & Traffic Channels:** Detailed breakdown of top countries, cities, device types, and visitor acquisition sources.
* **Engagement & Activity:** Visual charts of conversation volume, message counts, funnel conversion, and top clicked triggers.
* **What Worked vs What Didn't:** Clear breakdown of successful user interactions compared to areas where visitors experienced friction.
* **Blind Spots & Knowledge Gaps:** Highlights questions where the AI provided weak or incomplete responses, showing you exactly what information is missing from your knowledge base.
* **Actionable Recommendations:** Tailored, step-by-step suggestions generated by AI to help you optimize triggers, update training documents, and increase response quality.
***
## Downloading and Exporting
You can download any generated report for offline review, sharing with team members, or archiving by clicking the **Download** button at the top of the report view.
To access AI Reports, click the **Reports** button in the top-right corner of the **Overview** dashboard, or navigate directly to `/overview/your-chat-slug/reports`.
***
## Generating a Report
1. Click **Reports** in the top navigation of the Overview dashboard.
2. Click the **Generate Report** button.
3. Select your desired time period:
* **Pre-set ranges:** Last 7 days, 14 days, 30 days, 90 days, or 12 months.
* **Custom range:** Select precise start and end dates using the calendar picker.
4. Choose your preferred **Report Language** (for example English, French, Portuguese, Spanish, German, or Japanese). The report will be generated entirely in the selected language.
5. Click **Generate**. Attlas will analyze your chat history and generate your report in seconds.
Available historical date ranges depend on your workspace plan level.
***
## What's Included in a Report
Each AI Report compiles data and AI analysis into actionable sections:
* **Executive Summary:** Key highlights, top performing areas, and primary takeaways.
* **Audience & Traffic Channels:** Detailed breakdown of top countries, cities, device types, and visitor acquisition sources.
* **Engagement & Activity:** Visual charts of conversation volume, message counts, funnel conversion, and top clicked triggers.
* **What Worked vs What Didn't:** Clear breakdown of successful user interactions compared to areas where visitors experienced friction.
* **Blind Spots & Knowledge Gaps:** Highlights questions where the AI provided weak or incomplete responses, showing you exactly what information is missing from your knowledge base.
* **Actionable Recommendations:** Tailored, step-by-step suggestions generated by AI to help you optimize triggers, update training documents, and increase response quality.
***
## Downloading and Exporting
You can download any generated report for offline review, sharing with team members, or archiving by clicking the **Download** button at the top of the report view.